A spot UT reading tells you the wall thickness at one point on one day. Continuous wall thickness monitoring, in contrast, follows metal loss across a whole section of pipe, so you see erosion and corrosion while they develop.
This article compares periodic spot UT with permanently installed guided-wave systems. In addition, it explains how the ClampOn CEM® maps wall loss, where to place it, and how the data supports integrity decisions.
Why Periodic Spot UT Leaves Gaps
Manual ultrasonic thickness gauging measures straight through the wall under the probe. The method is simple and useful; however, it only reports the points that the inspector actually measures. Erosion in a bend can strike anywhere, so a grid of spot readings may miss the thinnest area entirely.
Timing is the second gap. Inspection crews visit on a fixed interval, therefore a sudden sand event or a failing inhibitor programme can thin the wall long before the next round. Moreover, every survey needs access, scaffolding or insulation removal, and the result depends on where the probe sits each time.
What Continuous Wall Thickness Monitoring Changes
A permanent system measures the same area again and again from fixed positions. As a result, it removes the scatter that comes from repositioning a probe, and it turns separate snapshots into a trend. Instead of asking how thick the wall is today, you can ask how fast it is thinning and why.
| Aspect | Periodic spot UT | Continuous monitoring |
|---|---|---|
| Coverage | Only the points under the probe | An area between transducer rings, so localized loss is not missed |
| Frequency | Once per inspection visit | Real time, at intervals the operator sets |
| Access | A crew on site for every survey | No repeat access after installation, therefore remote sections stay covered |
| Result | Separate readings that are hard to compare | A trend, so the wall-loss rate becomes visible |
How the ClampOn CEM Measures Wall Loss
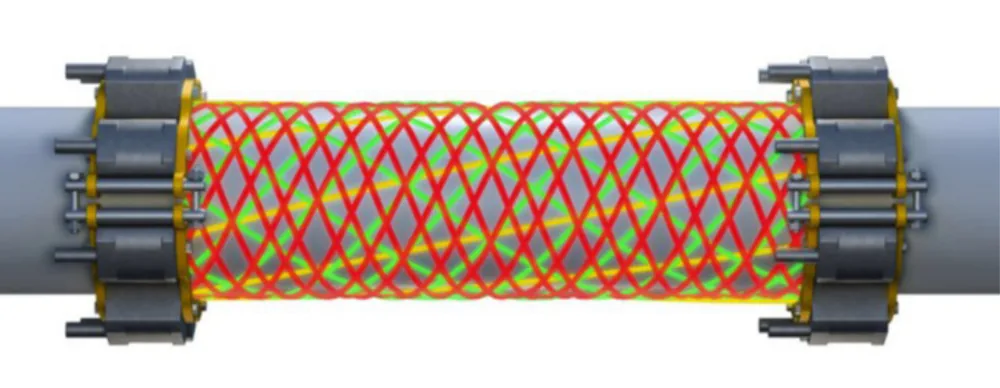
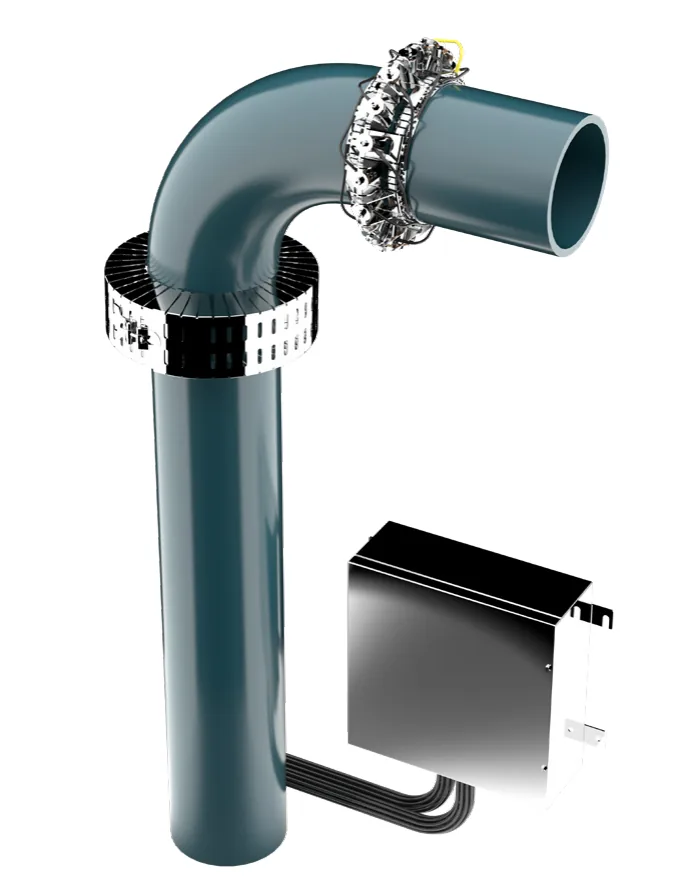
The ClampOn CEM® Corrosion-Erosion Monitor uses active ultrasound instead of point gauging. Pairs of transducers work in pitch-catch mode: one sends an acoustic guided Lamb wave along the pipe wall, and the other receives it. Because the phase velocity of this wave depends on wall thickness, a phase change in the received signal reveals thinning.
At installation, the system records a baseline. Later, it converts any change against that baseline into a change in mean wall thickness across an elliptical area between the two transducers. That area is much wider than the transducer footprint, so a few sensors watch a large section of pipe.
Transducers, Coverage and Sensitivity
The transducers are EMATs (electromagnetic acoustic transducers). They need no couplant, and topside they can sit on coating up to 1 mm thick. Stainless steel clamping bands hold them in place, so nothing ever penetrates the pipe. According to the ClampOn datasheet, the main figures are:
| Principle | Active ultrasound with guided Lamb waves, so one path covers an area |
| Sensitivity | 0.1% wall-thickness change against the baseline |
| Repeatability | Better than 1% for single measurements, therefore trends stay reliable |
| Wall thickness range | 8 to 50 mm, depending on the transducer type |
| Transducers | 4 to 32 per head unit, typically in two rings |
| Coverage area | Typically 0.3 to 1 m², because it depends on geometry and transducer count |
| Pipe size and material | From 114 mm (4 Inch NPS) OD with no upper limit, and all steel alloys |
| Output | Remaining wall thickness in mm, for example over RS-485 Modbus RTU |
With 16 or 32 transducers, the system creates hundreds of overlapping paths. In addition, CorrPRINT™ tomography software combines those paths into a wall-thickness map that shows the position and depth of the thinnest spots.
Topside and Subsea Wall Thickness Monitoring
The topside CEM mounts its head unit close to the pipe and connects to a safe-area controller that runs ClampOn CEM Server. From there, the data flows to the control system; at a minimum, it passes on the average wall thickness. Moreover, the system needs no recalibration after installation.
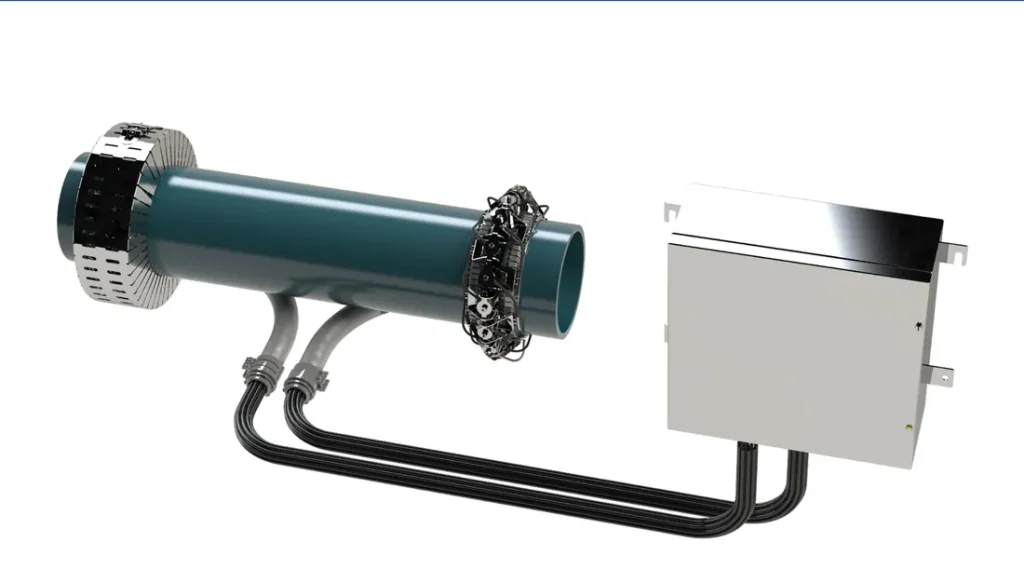
Subsea assets need a different package. The Subsea CEM comes in three non-intrusive models: ROV-installable for retrofit, pre-installed before the structure goes under water, and diver-installable. Its EMATs work through coating up to 3 mm, and a standalone version runs on batteries for up to 10 years while it sends data acoustically to the surface.
Where to Place a Wall Thickness Monitoring System
A permanent system pays off where metal loss is likely and inspection is difficult. Therefore, choose locations by flow, sand and corrosion risk rather than by convenience.
- Bends and elbows, because particles hit the outer wall there and the wear pattern is uneven.
- Downstream of chokes, since high velocity and turbulence concentrate wear just after the restriction.
- Sand-prone flowlines, especially wells that a sand monitor has already flagged.
- Low points and dead legs, for example where water settles and drives internal corrosion.
- Hard-to-reach sections, so buried, insulated or subsea pipe stays under watch without repeat access.
Using Wall Thickness Monitoring Data for Integrity Decisions
A trend of remaining wall thickness answers questions that single readings cannot. For example, a rising wall-loss rate after a production change points straight at erosion, so operators can adjust the choke or the rate before damage grows.
- First, set inspection intervals on measured wall loss instead of a fixed calendar.
- Next, tune corrosion inhibitor dosing, because the data shows whether the programme works and so prevents both under- and over-dosing.
- In addition, pair the CEM with an acoustic sand monitor, so you see the cause and the effect on the same pipe section.
- Finally, feed remaining-wall data into repair planning and fitness-for-service reviews.
You can read more about the cause side in our guide to acoustic sand detection. For related topics, browse our integrity monitoring and leak detection articles.
PT Saka Nusa Persada supplies the ClampOn CEM monitor, together with the other instruments on our ClampOn sensors page. The manufacturer also publishes technical background at ClampOn.
Need to know how fast your bends are thinning? Request a technical assessment We will review your lines and propose transducer locations for continuous monitoring.