Sand rarely announces itself until a choke erodes or a bend starts to thin. Acoustic sand detection changes that, because a clamp-on sensor can hear sand the moment a well starts producing it.
This article explains how the method works, what it can and cannot tell you, and how to choose between topside, subsea and wireless instruments. In addition, we cover the installation details that decide whether the data is useful.
Why Produced Sand Matters
Even small quantities of particles in the well flow can cause significant damage. Sand erodes chokes, bends, tees and valves, and it settles in separators and low points. Consequently, operators face a trade-off: produce harder and risk erosion, or hold back and lose production.
The goal of sand management is therefore not zero sand at any cost. Instead, it is to find the highest production rate the well can sustain with no sand, or with an acceptable sand rate. To do that, you need a measurement that is quantitative, continuous and immediate.
How Acoustic Sand Detection Works
Sand particles travelling in the flow hit the inside of the pipe wall just after a bend. Each impact generates an ultrasonic signal that travels through the steel. A passive ultrasonic sensor clamped to the outside of the pipe picks up this signal with a piezoelectric transducer.
Flow itself also makes noise, so raw sound is not enough. For this reason, ClampOn instruments process the signal inside the sensor with Digital Signal Processing (DSP). The DSP separates particle impacts from background flow noise and reports the result in real time. When the SandQ+ algorithm is configured, the topside instrument can even report the sand rate in g/s.
What the Sensor Can Detect
According to the ClampOn datasheets, the instruments detect particles down to 25 µm in oil and 15 µm in gas. The minimum sand rate is 0.01 g/s, and the flow needs a velocity of at least 0.5 m/s. In addition, repeatability is better than 1%, which matters most when you compare trends over weeks.
| Measurement principle | Passive ultrasonic, so nothing touches the process |
| Minimum particle size | 25 µm in oil, 15 µm in gas |
| Minimum sand rate | 0.01 g/s, depending on flow conditions |
| Minimum flow velocity | 0.5 m/s, because slower particles impact too softly |
| Flow regimes | Oil, gas, water and multiphase |
Where to Install an Acoustic Sand Detection Sensor
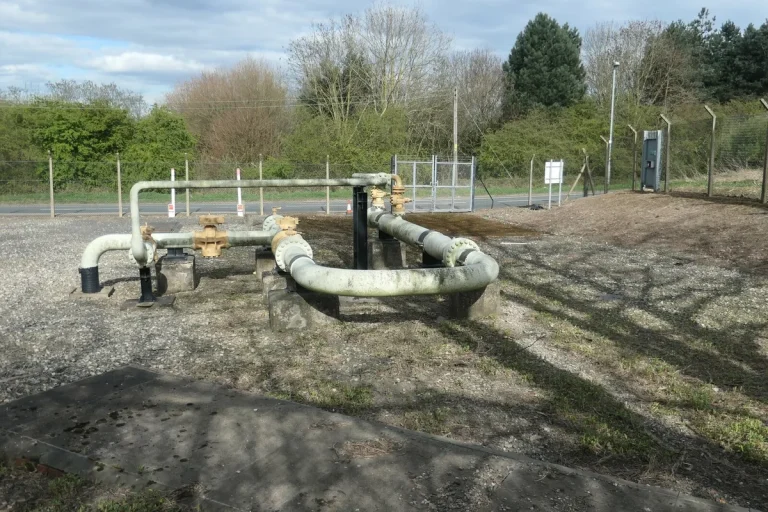
Location is everything. The sensor belongs just downstream of a bend or elbow, where the turbulent flow profile is fully developed and particles strike the wall. A straight run far from any bend, in contrast, gives weak and unreliable impacts.
- One sensor per well flowline, so you can see which well produces sand.
- After the first bend downstream of the choke, because that is where impacts are strongest.
- On a bracket fixed with stainless steel clamping bands, or welded to the pipe surface, so no hole is ever drilled.
- Away from strong mechanical noise sources, for example pumps or control valves, whenever the layout allows.
Topside, Subsea or Wireless?
The same acoustic principle comes in three formats, and the right one depends on where your wells are and how they are wired.
- Topside, cabled: the ClampOn DSP Particle Monitor comes in Ex d and Ex i versions with RS-485 and 4–20 mA outputs, so it fits most control systems.
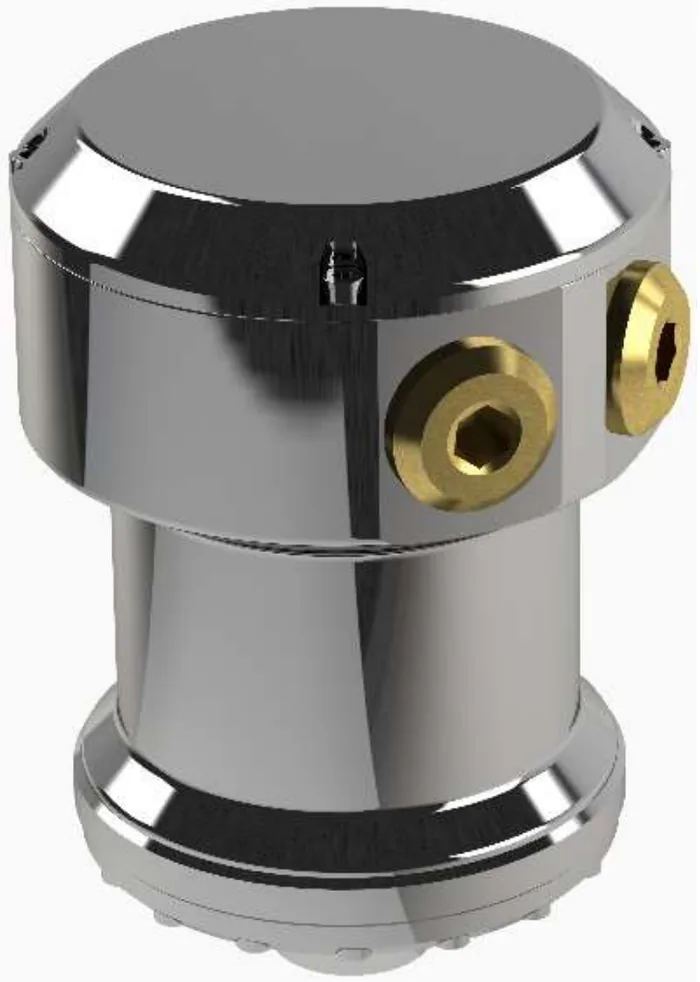
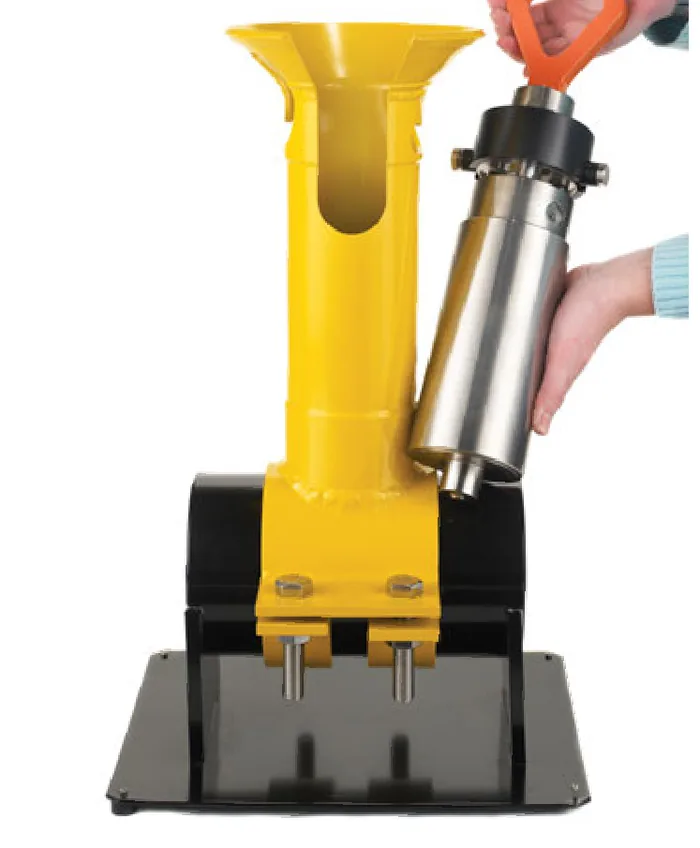
- Subsea: the ClampOn Subsea Particle Monitor has a titanium body, sits in a funnel, and can calculate sand rate onboard.
- Wireless: the ClampOn BIRD Particle Monitor runs on a PowerModule and joins a self-forming mesh network, especially for remote pads.
From Sand Data to Better Decisions
Real-time sand data supports several decisions at once. First, it shows the maximum sand-free rate during well tests. Next, it raises an alarm as soon as a sand event starts. Finally, long-term trends show which wells need sand control or a different choke strategy.
Sand data also explains wall loss. For example, pairing a sand monitor with the ClampOn CEM corrosion-erosion monitor shows both the cause and the effect of erosion on the same section of pipe.
Common Acoustic Sand Detection Mistakes
- Installing the sensor on a straight run, so particles barely touch the wall.
- Ignoring flow velocity, because below 0.5 m/s impacts become too weak to measure.
- Reading single values instead of trends, although trends reveal the real behaviour.
- Skipping integration, therefore alarms never reach the operators who need them.
PT Saka Nusa Persada supplies the full ClampOn range in Indonesia. You can browse all of it on our ClampOn sensors page, and the manufacturer also publishes background at ClampOn.
Want to know which of your wells produce sand? Request a technical assessment We will propose sensor locations and integration for your flowlines.